
In a heartwarming gesture to close out 2023 and usher in the new year, our dear friend, mentor, and fatherly figure to me, Greg, has shared a treasure trove of insights on SSIH. This unexpected and heartwarming gift is a testament to Greg’s generosity and commitment to our community. Let’s delve into the charts he provided, each offering a glimpse into his astute technical analysis as he wishes everyone a Merry Christmas and a Happy New Year!

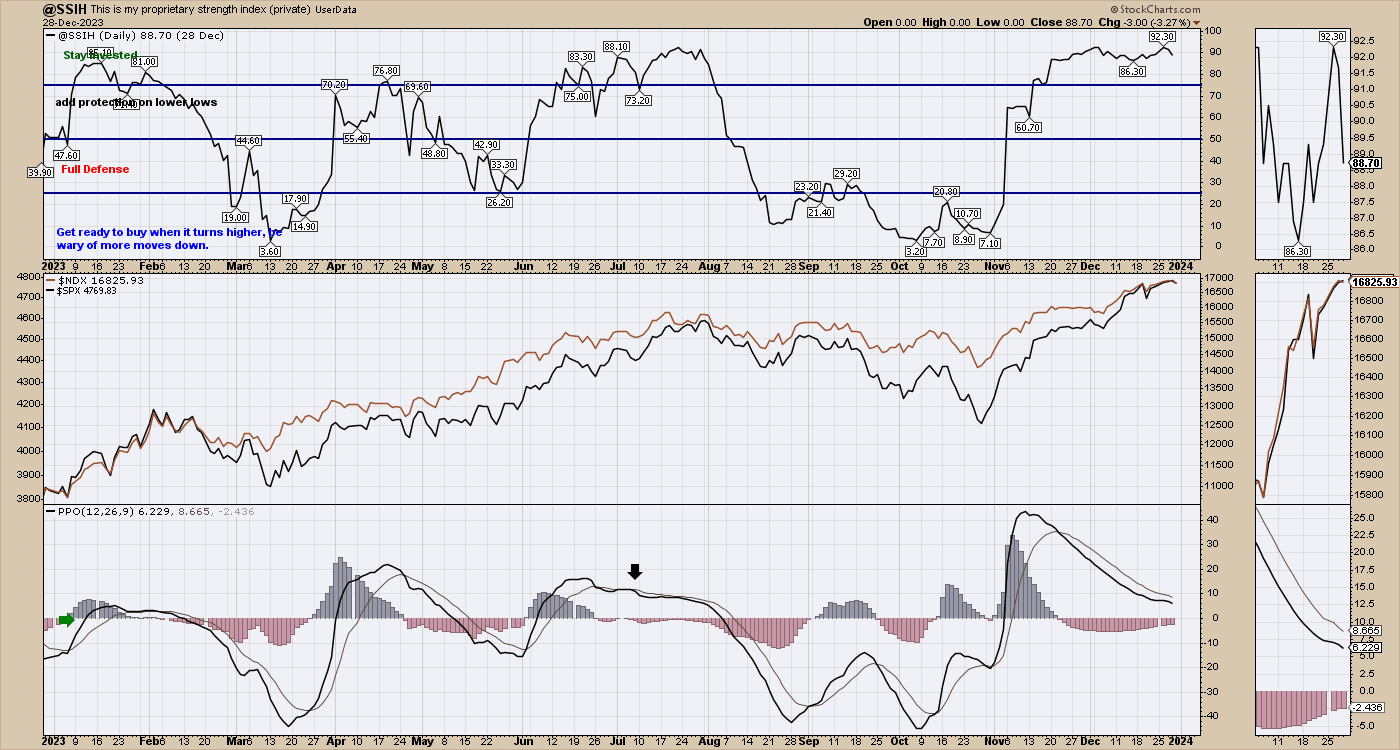
As we delve into the first chart, which encapsulates the essence of SSIH, Greg’s seasoned perspective comes to the fore. With a watchful eye on the market meandering sideways, he calmly notes, “As long as it stays above 50, that’s okay for me.” This measured approach reflects not only his technical expertise but also his resilience in navigating the market’s subtle shifts, particularly those discussed since November. Despite the limited upward movement in the last two weeks, Greg remains steadfast in his outlook, especially in light of the $NDX and $SPX both signaling a PPO sell signal to close the week.
SSIH
Moving on to the next chart, we encounter SSIF—a faster signal.
SSIF

Transitioning to the next chart, SSIQ takes center stage, maintaining its position above 50%, albeit showing signs of softening. Greg’s discerning eye is quick to notice the subtle shifts in the market dynamics. “SSIQ is still holding above 50%, but softening,” he observes. Notably, he points out a crucial development—the UpTrend line on the SPX and NDX was cut on Friday.
SSIQ

Moving forward to the subsequent chart, Greg’s analysis unveils a comprehensive view of the market landscape. With a reassuring tone, he emphasizes, “The three of them are still okay.” However, a discerning eye can spot nuances, especially as Greg delves into SSIF’s performance. “SSIF is weaker,” he notes, backed by a keen observation— the difference chart between SSIQ and SSIF widened by almost 50 points on a given day. This subtle yet significant detail underscores Greg’s ability to detect emerging weaknesses and provides valuable insights for our community.
All Three SSI Indicators

Shifting our focus to the broader market dynamics, Greg’s attention turns to $SPX, shedding light on its recent performance. Notably, he points out a nuanced observation, ” $SPX had low volume on the weekly, reminiscent of the patterns observed last year.” Greg’s ability to draw parallels across time frames enhances our understanding of historical market trends. Furthermore, he highlights a critical development—a sell signal on the PPO occurred on Friday’s daily chart. This timely insight into the technical indicators of a key market index adds another layer to Greg’s comprehensive analysis.
S&P 500 ETF – Daily Chart

Delving into the temporal aspect of the market journey, Greg provides a notable observation. He highlights that it took twice as long for the market to reclaim prior highs compared to the duration of the drop from December 2021 to the October 2022 lows. This elongated timeline brings attention to the resilience and complexity of the current market dynamics, as we navigate the challenges presented in the journey from 2021 through 2022 and into the testing grounds of prior highs in 2023.
SPX – Weekly Chart

In our closing reflection on the charts, Greg shares a pivotal observation: The NDX has just experienced its lowest volume week in the last two years. This mirrors a historical pattern, reminiscent of the final high in late 2021, accompanied by a PPO making a lower high. This significant revelation sheds light on the present market dynamics, emphasizing the potential implications for the future. With this insightful analysis in hand, we move forward, acknowledging the echoes of history and navigating the intricate dance of market forces with heightened awareness and strategic foresight.
Nasdaq ETF – Daily Chart

NDX – Weekly Chart